

Calculating Ergonomic ROI: A Guide to Maximizing Workplace Investment
Calculating Ergonomic ROI: A Complete Guide to Measuring Workplace Investment Returns
Introduction
Ergonomic ROI calculation measures the financial return a business receives from investing in workplace ergonomic solutions, expressed as a ratio of benefits gained to costs spent. The standard formula to calculate ROI for ergonomic solutions is ROI = (Net Financial Benefits / Total Cost of Intervention) x 100%.
This guide covers direct cost savings, productivity gains, and injury prevention benefits. It does not address broader wellness program metrics such as mental health initiatives or nutrition programs, which involve separate measurement frameworks. The target audience is HR managers, facilities directors, and decision makers evaluating ergonomic furniture and workspace solutions for their organizations.
Ergonomic ROI is calculated by dividing total annual benefits (injury cost savings plus productivity gains) by the initial investment costs. Ergonomic programs save more than they cost, with the average payback period for ergonomic interventions clocking in at less than one year across multiple studies.
By the end of this guide, you will:
- Master cost benefit analysis methods for ergonomic investments
- Understand payback period and benefit cost ratio calculations
- Learn to quantify productivity improvements and injury savings
- Access practical ROI calculator tools for immediate use
- Know how to build a business case using Singapore-specific data
Understanding Ergonomics Program ROI Fundamentals
Ergonomic ROI is a financial metric comparing what a business spends on ergonomic improvements against the measurable workplace benefits those improvements produce. For Singapore businesses, this calculation carries particular weight: the economic loss due to work-related musculoskeletal disorders (WRMSDs) was estimated at SGD 3.5 billion in 2011, approximately 1% of Singapore's GDP. Under the WSH Act and standards like SS 514 for office ergonomics and SS 569 for manual handling, employers face both regulatory obligations and financial incentives to address ergonomic risk.
Direct Cost Components and Injury Costs
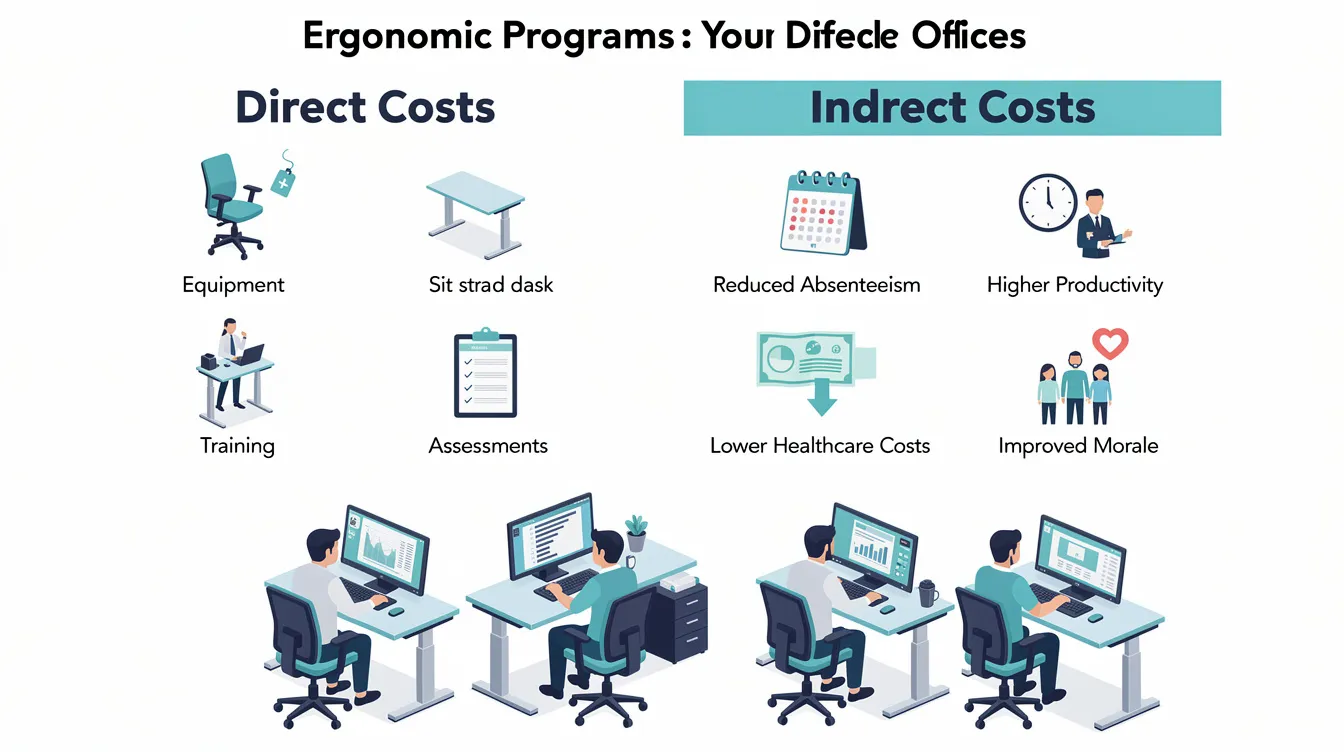
Direct costs in an ergonomics program fall into two categories: the costs you invest and the costs you aim to prevent.
On the investment side, calculating total costs of ergonomic solutions requires accounting for equipment purchases, assessments, and training. A high-quality ergonomic chair typically runs SGD 800–1,500; a sit-stand desk costs SGD 1,200–2,500. Add installation, setup, and any technology costs such as AI posture analysis tools. Total Cost of the Intervention includes direct and indirect expenses for ergonomic upgrades.
On the prevention side, direct cost reductions are measured by the decrease in workers' compensation claims and medical costs. In Singapore, MOM data from 1H 2026 shows that of 620 occupational disease cases, 23% were WRMSDs, and ergonomic interventions also help prevent employees injuring themselves during manual handling tasks. Each claim carries medical expenses, lost-time injury costs, and potential compensation payouts, including preventable cases such as back strain. Ergonomic programs can reduce injury claim costs by $16,500 per claim on average. Indirect costs of injuries can outweigh direct costs by a 4:1 ratio, meaning a $10,000 claim actually costs the organization closer to $50,000 when accounting for replacement labor, administrative burden, and disrupted operations.
Indirect Benefit Factors
Financial benefits of ergonomic solutions extend beyond workers compensation costs into three measurable areas.
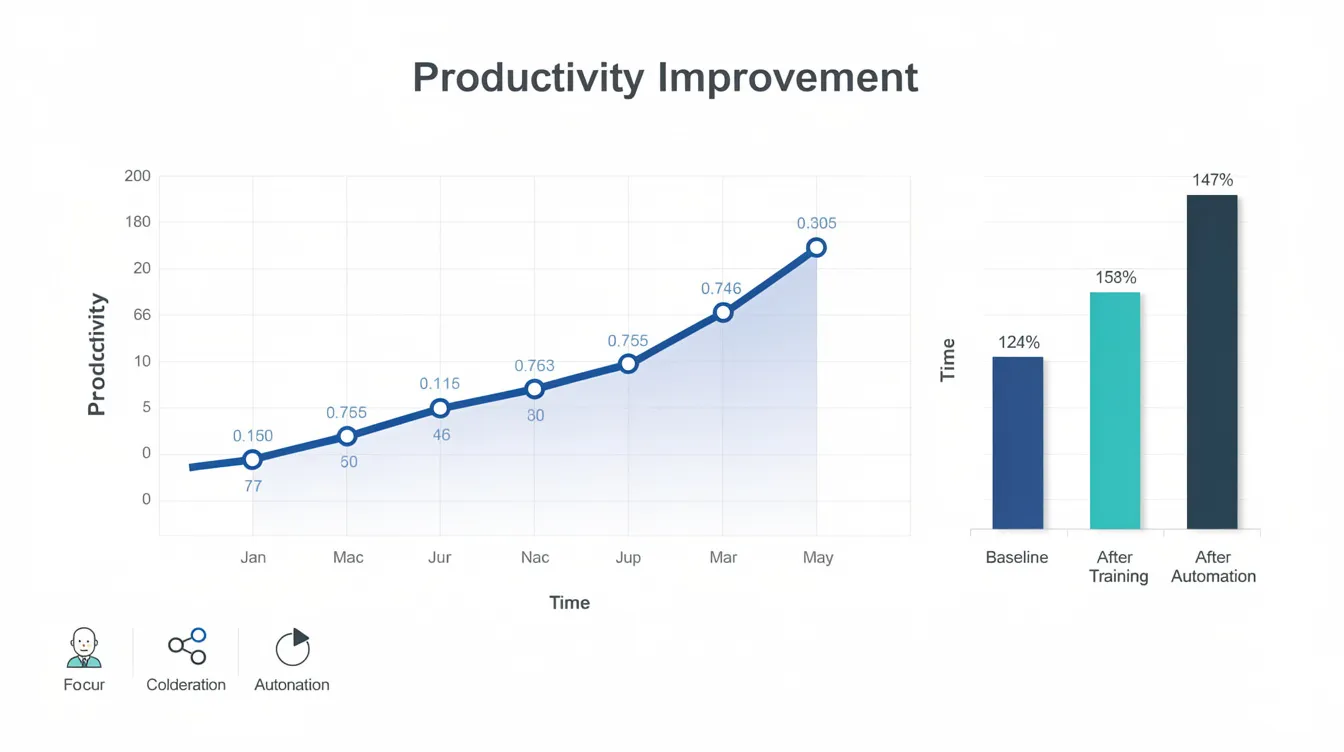
Productivity gains. Productivity and efficiency are tracked by changes in output speed and task completion time. Manufacturing case studies recorded productivity increases of 4.4% to 28.4% following workstation improvements. A case increased productivity more than double at specific workstations in one paper manufacturing facility.
Reduced absenteeism and presenteeism. Absenteeism and presenteeism metrics include monitoring drops in sick leave days and quality of work output. Tracking sick days and unplanned absences is crucial for measuring the impact of ergonomics on employee well-being.
Employee retention. Higher job satisfaction and lower turnover have been linked to investments in ergonomic working conditions. ASSP/AEA case studies document retention-related savings of USD 3,000 to USD 30,000 annually depending on company size and turnover baseline.
A strong business case for ergonomics combines productivity, health, retention, and risk reduction metrics. Quantifying these benefits is what separates a vague cost justification from a compelling return on investment analysis.
Key ROI Calculation Metrics and Methods
Three calculation approaches serve different evaluation needs. Choosing the right one depends on whether you need a quick snapshot, a timeline estimate, or a multi-year projection.
Benefit Cost Ratio Analysis
The benefit cost ratio measures total annual benefits divided by total costs. If a company spends SGD 50,000 on ergonomic furniture and training, then realizes SGD 30,000 in injury savings and SGD 25,000 in productivity improvements, the estimated benefits total SGD 55,000. The benefit cost ratio is 55,000 ÷ 50,000 = 1.1, indicating net positive return.
Any ratio above 1.0 means the investment produces more money than it consumes. U.S. manufacturing studies documented benefit-cost ratios ranging from 5 to 84, with productivity improvements as the largest contributor to saving benefits. A benefit-to-cost ratio of nearly 25 times was reported for certain interventions, indicating that a proposal's benefit cost related returns can be substantial when ergonomic risk is high at baseline.
Payback Period Calculation
The payback period indicates how quickly an ergonomic investment recovers its costs. Divide the initial cost by annual savings to determine how many months or years until the investment breaks even.
One Washington State case provides a concrete example: a company achieved direct cost savings of approximately USD 67,000 per year among 260 employees after an exercise that cost USD 10,000 over three years. The pay back period came in at less than one year when indirect benefits were included. Rick Goggins and colleagues at the Washington State Department of Labor and Industries developed calculation tools, adapted by the Puget Sound Chapter of the Human Factors and Ergonomics Society, that practitioners still use as benchmarks. The average payback period for ergonomic interventions is less than one year across the studies reviewed.
Net Present Value Assessment
NPV applies when benefits and costs stretch over multiple years. Future benefit streams are discounted to present value using a rate that reflects the company's cost of capital. Singapore firms typically use internal hurdle rates of 5–8%.
For a five-year ergonomic program, NPV accounts for equipment divided across its useful life, maintenance costs, and the compounding effect of annual worth from injury prevention. Projects with positive NPV are financially sound. This method suits larger-scale evaluations, such as a company investing SGD 500,000 in a facility-wide ergonomics intervention where benefits accrue progressively over 3–5 years.
Each method answers a different question: BCR tells you the magnitude of return, payback period tells you when you recover the initial investment, and NPV tells you the total value created over time.
Step-by-Step ROI Calculation Process
A formal ergonomic ROI analysis is warranted whenever equipment purchases exceed SGD 20,000, when you need approval from finance or leadership, or when you want to measure whether an existing ergonomic program delivers on its promises.
Data Collection and Baseline Establishment
Accurate baseline data determines the credibility of every number that follows. NIOSH recommends evaluating ergonomic programs by comparing pre- and post-intervention data like absenteeism and turnover.
- Gather historical workers' compensation claims data. Pull 12–24 months of records showing the number of WRMSD claims, cost per claim, and lost workdays. In Singapore, MOM reports indicate about 338 WRMSD cases per year pre-2024, with 91% being back injuries from manual lifting and poor posture; when estimating preventable manual-task injuries, include potential sprains in the baseline as well. Use these as industry benchmarks if internal data is limited.
- Document current productivity metrics. Record output per employee, task completion times, error rates, and production quality measures. These become your pre intervention comparison points.
- Calculate existing ergonomic-related costs. Sum medical expenses, compensation payouts, replacement labor costs, and administrative handling fees. Remember that indirect costs can outweigh direct costs by a 4:1 ratio.
- Establish a 12-month baseline period. Shorter windows introduce seasonal distortion; longer windows risk including organizational changes that muddy attribution.
Investment Cost Documentation
Record every expense associated with the ergonomics intervention to build an accurate denominator for your ROI formula.
- Equipment purchases: ergonomic chairs, standing desks, monitor arms, anti-fatigue mats, lift table devices, keyboard trays. Document unit costs and quantities. In higher-risk settings, a new system may replace manual handling equipment; if scrap conveyor systems installed are used to transport scrap metal, the cost log should capture purchase, installation, and setup costs.
- Installation and setup: shipping, assembly labor, workstation configuration. Ergoworks provides free installation, which reduces this line item to zero for their products.
- Training and assessment: employee training sessions on posture and correct equipment use; ergonomic assessment fees; AI posture analysis tool costs.
- Ongoing maintenance: warranty coverage, replacement schedules, accessories refresh cycles.
Sum these to determine total first-year investment amount. A clear ROI model should also show what the system saves through documented efficiency gains or injury-prevention results.
Benefit Quantification and ROI Calculation
The financial evaluation matrix measures factors such as insurance claims, productivity, and employee turnover rates. Here is how the three methods compare when applied to the same hypothetical scenario:
|
Metric |
Formula |
Example (SGD 50,000 investment) |
|---|---|---|
|
ROI (%) |
(Net Benefits ÷ Total Cost) × 100 |
(55,000 − 50,000) ÷ 50,000 × 100 = 10% |
|
Benefit Cost Ratio |
Annual Benefits ÷ Total Cost |
55,000 ÷ 50,000 = 1.1 |
|
Payback Period |
Total Cost ÷ Annual Benefits |
50,000 ÷ 55,000 = 10.9 months |
|
NPV (5%, 3 years) |
Σ(Benefits ÷ (1+r)^n) − Cost |
~SGD 99,773 |
|
Total savings from ergonomic interventions can reach $88,185 annually for organizations with moderate injury rates and 50+ employees. In a documented paper manufacturing case, a company invested USD 2.5 million in an ergonomic program from 1991–1996 and gained USD 3.5 million in benefits over five years. Lost-time cumulative trauma disorders dropped over 80%, and employee discomfort fell 40% in targeted areas. |
|
|
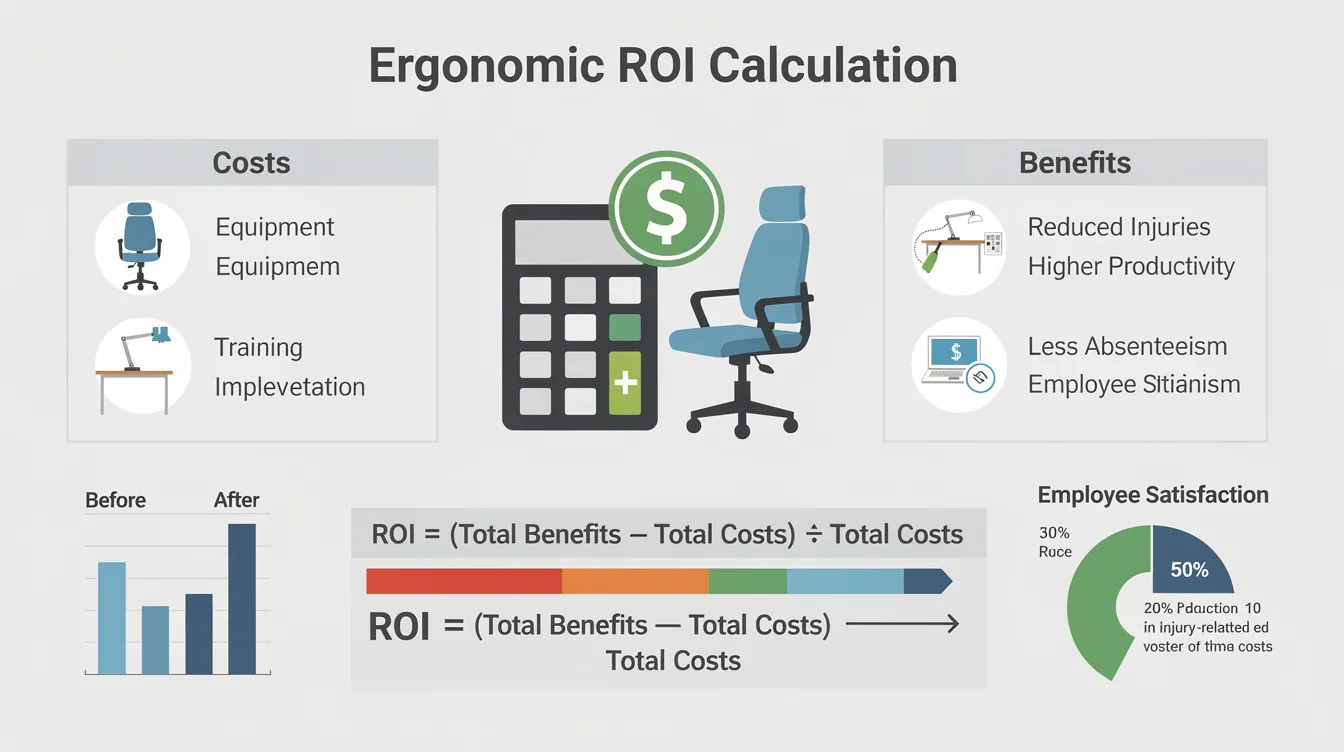
Quantifying financial benefits from ergonomics includes factors such as assessing reductions in injuries and productivity improvements. The CDC's ergonomic program evaluation guidelines provide standardized formulas that the National Institute for Occupational Safety and Health developed specifically for this purpose.
Common Challenges and Solutions
Three obstacles consistently appear when organizations attempt to measure return on investment ROI from ergonomic interventions.
Incomplete Workers' Compensation Data
Many WRMSDs go unreported or get classified under general sick leave rather than occupational injury. In Singapore, only confirmed occupational disease cases enter MOM statistics, leaving a gap between actual incidence and recorded data. When internal records are sparse, use industry benchmarks from WSH statistics for Singapore workplaces. MOM's confirmed WRMSD data and injury rate trends provide a defensible estimate for injuries prevented and associated cost per claim. The ERGO-ROI Calculator, a free tool for practitioners, uses Ontario's WSIB lost-time claim statistics for estimates and was adapted from a 2015 Washington State tool. It provides a printable report of expected injury savings, making it useful when your own data has gaps.
Difficulty Measuring Productivity Improvements
Productivity is influenced by dozens of variables: management changes, seasonal demand, new software, team composition. Isolating the effect of an ergonomics intervention requires discipline. Focus on measurable outputs: reduced sick days, faster task completion on standardized work, and employee satisfaction survey scores collected at consistent intervals. The Lahiri, Gold & Levenstein net-cost model defines a structured framework separating intervention costs from avoided costs (lost work time, medical care, plus productivity gains), which helps isolate ergonomic contributions from other factors.
Long-Term Benefit Attribution
A systematic review of organizational-level ergonomic interventions found that seven of nine evaluated programs produced positive economic results, but outcomes depended on implementation quality. Programs with low management support or low employee participation showed poor cost effectiveness. One intervention failed to demonstrate cost-effectiveness entirely, though it still reduced absenteeism. Healthcare sector lifting equipment policies had payback periods of 3–5 years from the employer's perspective.
Establish clear measurement periods, use conservative estimates, and review quarterly. Employee comfort and safety are essential factors in the engagement and participation in safety initiatives; without buy-in, even well-designed programs underperform. Ergonomics can improve employee well-being, thereby fostering job satisfaction and engagement, but only when implementation includes adequate training and ongoing reinforcement.
Conclusion and Next Steps
Ergonomic ROI calculation converts occupational safety spending into a measurable business metric. The data is consistent: ergonomic improvements can lower workers' compensation costs, reduce injury rates, and drive increased productivity. In one set of electronics manufacturing case studies, ergonomics improvements generated roughly USD 130 million in savings through fewer injuries and higher output.
To move from reading to action:
- Run an immediate estimate. Use the Ergoworks Ergonomic ROI Calculator to input your employee count, current injury costs, and productivity baseline for a tailored ROI projection. The ERGO-ROI Calculator estimates benefits of ergonomic interventions using evidence-based data for cost effective decision-making.
- Gather your baseline data. Pull 12 months of workers' compensation records, sick leave logs, and production output numbers.
- Document your investment costs. Get quotes for equipment, installation, and training.
- Conduct quarterly ROI reviews. Track injury claims, absenteeism, and output against your pre-intervention baseline. Adjust estimates as real data replaces projections.
- Related areas worth exploring include workspace design optimization for specific roles, the integration of AI posture analysis tools into ongoing safety monitoring, and how Singapore's expanding occupational disease coverage under the WSH and Work Injury Compensation Acts affects your compliance obligations.
Additional Resources
- Ergoworks Corporate ROI Calculator: Input your organization's numbers for an instant cost benefit analysis with projected payback period and ROI percentage.
- Singapore WSH Guidelines: SS 514 (Office Ergonomics) and SS 569 (Manual Handling) define risk assessment standards that help estimate injury probabilities before and after intervention.
- CDC/NIOSH Ergonomic Program Evaluation Guide: Includes standardized formulas for benefit-cost ratio, payback period, and ROI with sample calculations.
- MOM Workplace Safety and Health Reports: Current WRMSD statistics and occupational disease data for Singapore-specific benchmarking.
Productivity measurement tools: Output-per-hour tracking, quality defect rate logs, and turnover cost calculators help quantify the indirect benefits that determine whether an ergonomic program delivers lasting returns.